THE ASAHI SHIMBUN
May 29, 2023 at 19:02 JST
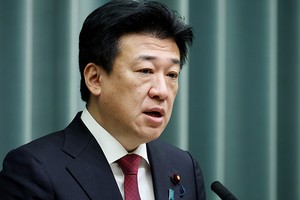
 Nobuyuki Baba, leader of Nippon Ishin, stands beside posters to recruit party candidates at the Diet building on April 24. (Koichi Ueda)
Nippon Ishin (Japan Innovation Party) for the first time has overtaken the main opposition Constitutional Democratic Party of Japan in terms of popularity among voters, an Asahi Shimbun survey showed.
Respondents in the nationwide telephone survey on May 27-28 were asked which party they would vote for in the proportional representation part of the next Lower House election.
The ruling Liberal Democratic Party topped the list, picked by 36 percent of respondents, followed by Nippon Ishin, at 17 percent, and the CDP, at 10 percent.
This was the 20th time the survey has asked respondents this question since the CDP was formed in 2017. The last time the question was asked was in October 2021, when the last Lower House election was held.
The latest survey represented the first time that more respondents picked Ishin than the CDP.
Ishin was more popular than the CDP in all age groups.
Among respondents in their 30s to 50s, the percentages choosing Ishin more than doubled the rates for the CDP.
The top choice among unaffiliated voters was the LDP at 20 percent, followed by Ishin at 15 percent and the CDP at 11 percent.
Among voters in the Kinki region in western Japan, where Ishin originates from, 33 percent chose the party, exceeding the 25 percent who picked the LDP.
Only 7 percent of respondents in the Kinki region chose the CDP.
In the Kanto region, which includes Tokyo, 38 percent chose the LDP, while Ishin and the CDP were tied at 12 percent.
The survey also asked respondents which party they wanted to see as the largest opposition force in the next Lower House election.
Forty-four percent named Ishin, topping the 32 percent who chose the CDP.
In addition, 47 percent of respondents agreed that opposition parties should unite in the next Lower House election, while 43 percent disagreed with that strategy.
The survey was conducted through calls to randomly selected telephone numbers. There were 417 valid responses from voters contacted by fixed telephones, or 48 percent, and 713 from those contacted by cellphones, or 41 percent.

Nippon Ishin to take on Komeito in next Lower House election
May 14, 2023
Nippon Ishin gains momentum ahead of Upper House election
May 2, 2022
EDITORIAL: Ishin’s Umemura disgraced party with remarks on dead detainee
May 19, 2023
Nippon Ishin’s election gains strike fear into heart of LDP
April 24, 2023
Survey: Voters divided on whether to revise Constitution
July 6, 2022
Survey: 47% feel LDP majority is ‘good,’ hope low for opposition
November 8, 2021


A peek through the music industry’s curtain at the producers who harnessed social media to help their idols go global.

A series based on diplomatic documents declassified by Japan’s Foreign Ministry

Here is a collection of first-hand accounts by “hibakusha” atomic bomb survivors.

Cooking experts, chefs and others involved in the field of food introduce their special recipes intertwined with their paths in life.

A series about Japanese-Americans and their memories of World War II


